Foto Friday: Bike Traffic Lights

Focusing on intersections again, this week we look at bike traffic lights. Paint across intersections work well on intersections that are a bit more traffic calmed but on a rat's nest like Montezuma Road and Fairmount Avenue, painted guidance across intersections can have mixed results especially when they require riders to navigate their way across lanes alongside fast moving vehicle traffic.
On intersections like Fairmount and Montezuma, different traffic light phases can be a solution in allowing motor vehicles and bicycles to coexist peacefully. Giving riders a small lead time to start along with preventing right turns on red can result in smoother and safer traffic flow for all.
What are your thoughts on the matter? Do you prefer timed lights or activated traffic lights?
Foto Friday: Interim Intersection Treatments
The most ideal treatment for an intersection is the Dutch standard. But is there an interim step that can be implemented sooner? We see a paint based solution that can be implemented on some intersections in the city and the region. Below is a photo of how paint is used to guide riders across intersections in Copenhagen - one of the top bike friendly cities in the world. Much thanks to Michael who sent the photo below:

Source: sitephocus.com via Sustainable Cities on Pinterest
In San Diego, bike lanes often get dropped at intersections which is the one place all road users need direction on how to navigate across. Long Beach began using green paint to highlight specific areas where roads users needed to be especially cautious and we see this as a very low cost solution to implement while working on actually redesigning the intersections to be more in tune with the Dutch standard.
The NACTO Urban Bikeway Guide states this about how intersections should be treated:
Designs for intersections with bicycle facilities should reduce conflict between bicyclists (and other vulnerable road users) and vehicles by heightening the level of visibility, denoting a clear right-of-way, and facilitating eye contact and awareness with competing modes. Intersection treatments can resolve both queuing and merging maneuvers for bicyclists, and are often coordinated with timed or specialized signals.
The configuration of a safe intersection for bicyclists may include elements such as color, signage, medians, signal detection, and pavement markings. Intersection design should take into consideration existing and anticipated bicyclist, pedestrian and motorist movements. In all cases, the degree of mixing or separation between bicyclists and other modes is intended to reduce the risk of crashes and increase bicyclist comfort. The level of treatment required for bicyclists at an intersection will depend on the bicycle facility type used, whether bicycle facilities are intersecting, the adjacent street function and land use
Where do you think would be ideal places to implement this sort of treatment?
Foto Friday: Bike Traffic in San Diego County and City
This week's edition of Foto Friday is more of a Graph Friday, which doesn't have much of a fun ring to it so we're sticking with the "Foto Friday" label.
The graphs below are a teaser for an article we will post next week on San Diego's bike traffic (both in the City of San Diego and around the county). All graphs are courtesy of Dr. Sherry Ryan who is heading the bike count effort at San Diego State University. For more on the bike counters in the county, read this piece by Robert Leone.
First up is a graph showing Portland's (a top U.S. bike city) bike traffic on a yearly basis over the four main bicycle bridges from 1992 to 2011.

Below is a graph depicting the bike traffic recorded this past March in Solana Beach

Below is a graph depicting the bike traffic on roads that have striped bike lanes. The data is from last month.

Below is a graph depicting the bike traffic on roads that have no bike facilities whatsoever. The data is from last month.

Considering our very deadly summer and the bike traffic counts noted above, the time is ripe to start allocating safe space on the roads to accommodate our growing bicycling population.
Edit: 11/1/2012. The last graph has been updated to be clearer about the type of road the data was gathered from. Class III routes have no bike infrastructure. Usually the road is populated by signage such as "bikes may use full lane" or "share the road".
Foto Friday: BikeSD.org's Vision Map
Last night, we formally launched as a bike advocacy organization. A writeup is forthcoming...but first, we need some help from you.
Howard Blackson, our local visionary and planner, lent his incredibly design and planning talent to designing our vision map which we unveiled yesterday at our launch party.
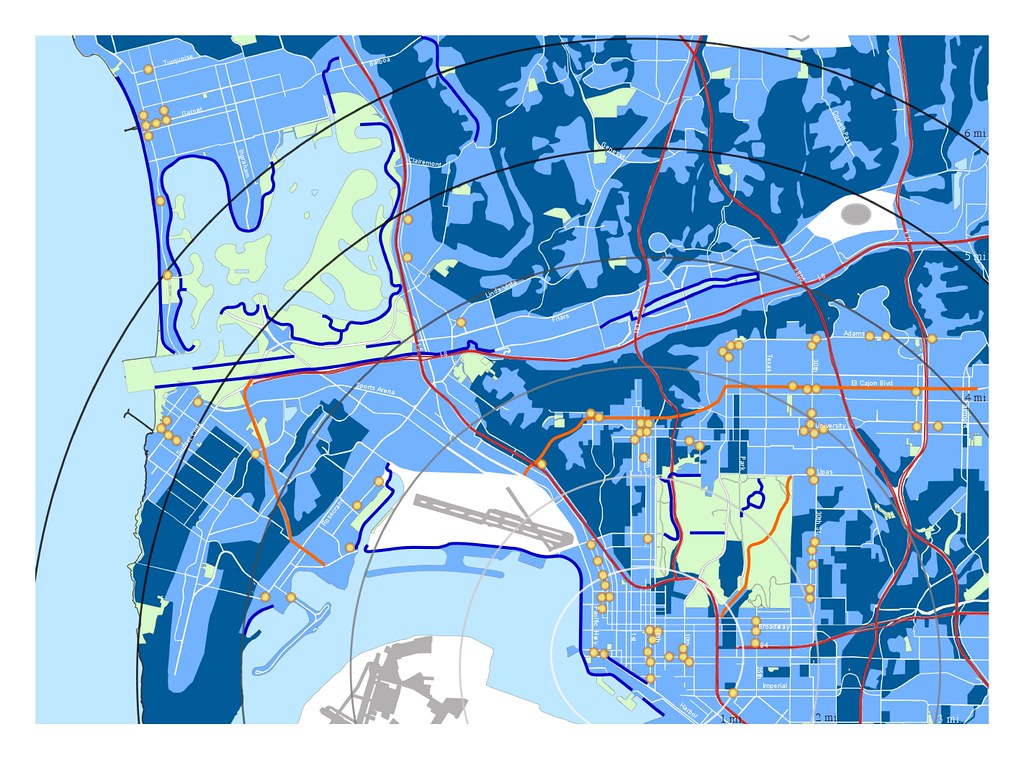
The vision map below is a version 0.1 and during the next 12 months, we're going to need your feedback to make this a truly visionary map - a guide on what our city will look like as a world-class bicycle friendly city. We focused on the mid-city and beach community only because we lack the resources for the time being to have a full scale city-wide map. Our goal is to expand the map to cover the entire city of San Diego after our first year.
San Diego is slowly making her name known around the world for her quality beer and it's time she rise up the ranks and be recognized for her bikeability as well. People ride to places where there is good beer, good food, along good bike routes. The map below depicts the our city's topography, her existing bike infrastructure (dark blue lines), our many freeways (red lines), our initial proposals for protected bike lanes such as cycletracks (orange lines) and the clusters of destinations (places to get breakfast and/or beer). The concentric circles are distance lines: each one being a mile apart from the other.
With your help, we want to add in more orange lines that will showcase what our city can truly look like as a world-class bicycle friendly city.
Does this mean we won't be doing anything else? Of course not! We plan on working on four specific campaigns to bring the issues to the forefront and ensure that San Diego does become the city we believe it can be. But in the meantime, we know that everyone who rides has a million and one ideas on how they would fix the city to make it more inviting to ride in and more livable. So send in those ideas!
Please leave comments, tweet your suggestions, post comments on our facebook page, upload your suggestions to flickr or instagram - but use the #bikeSD hashtag so we can keep track of all your feedback. If you want to do it the old fashioned way, send in your suggestions to talk@bikeSD.org with the subject "#bikeSD vision map". At the end of our first year, we want to have a clearer vision of what exactly we're going to be advocating for and your feedback will help clarify what that vision map looks like so we can be more effective advocates working on your behalf. You can use this google map that is open for editing to start adding your suggestions.
Howard Blackson is on twitter and you should most definitely follow him there to keep up with what's going on in the world of planning, urban design and tactical urbanism.
Edit: Per Phyllis Orrick's suggestion, we'll be overlaying the collision data from TIMS to determine where San Diegans ride and possible spots in San Diego that require needed attention.
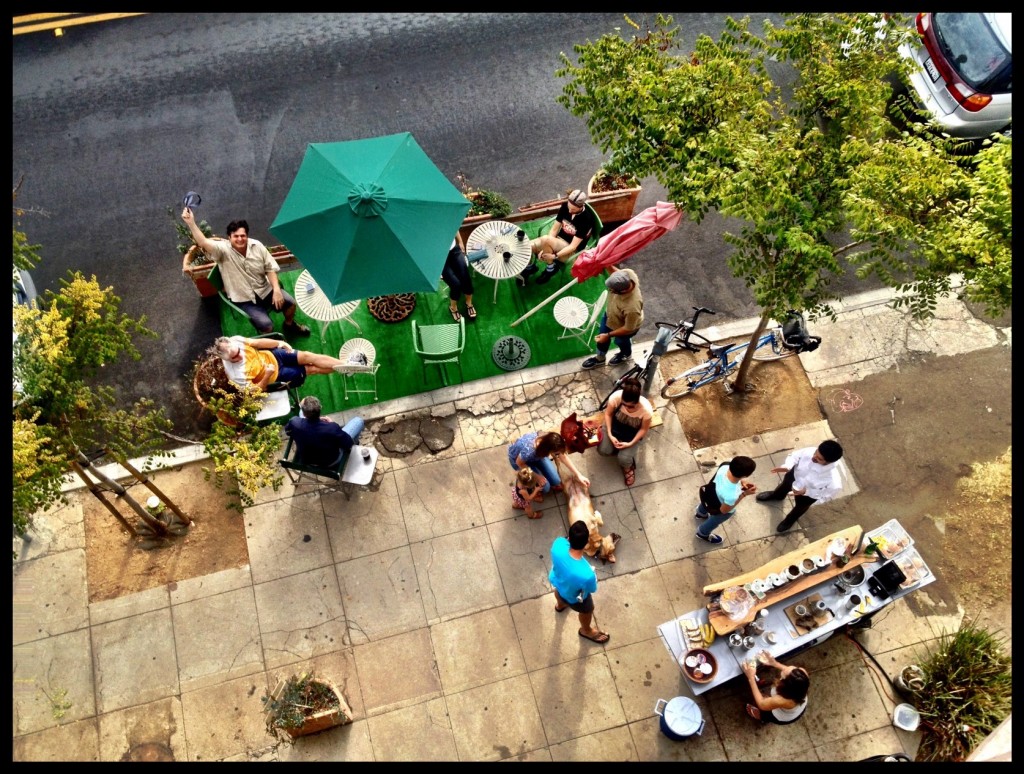
Foto Friday: Park(ing) Day
Here is the scene in front of Sea Rocket Bistro this morning: a small crowd of happy San Diegans enjoying a makeshift parklet: